 IMAS Metadata Catalogue
Climatology (excl. Climate Change Processes)
Type of resources
Topics
Keywords
Contact for the resource
Provided by
Years
-
Ice cores from Mount Brown South (MBS), East Antarctica, were drilled to help understand the past atmospheric circulation variability in the southern Indian Ocean and southwest Pacific Ocean. There are visible bubble-free layers occurring frequently multiple times a year, and the origin of these features is still unknown. This project aims to determine whether the bubble-free layers in the MBS ice core can be related to atmospheric processes. ERA-5 data, including surface (skin) temperature, 2 metre air temperature, wind at 10 metre height, the mean surface downward short-wave radiation flux and snowfall, is used to assess the target climate variables from 1979 to 2017 at the ice core sites.
-
Model output from a circumpolar realisation of the Regional Ocean Modelling System (ROMS). Model was run at a horizontal resolution of 1/4 degree and 31 vertical levels. Spatial domain was circumpolar out to 30 degrees South. Forcing comes from prescribed salt and heat fluxes based on a derived climatology from Tamura et al (2008). For open water regions the Tamura data is blended with open-water heat, salt and surface stress fluxes from a monthly NCEP2 climatology.
-
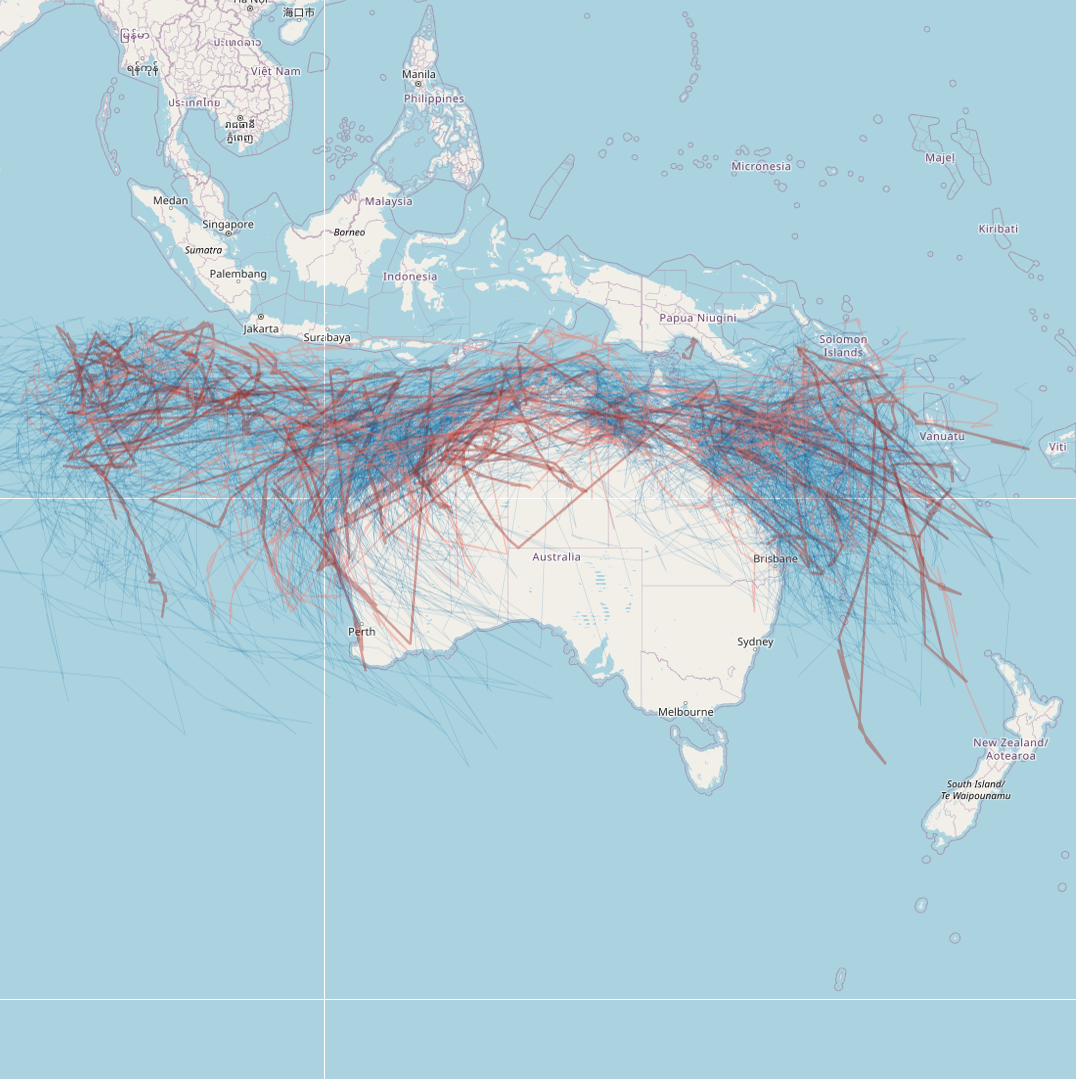
This dataset details all tropical cyclones that are known to have occurred in the region south of the equator between 90E and 160E. The data has been sourced from the Tropical Cyclone Database, maintained by the Bureau of Meteorology (BOM). This record represents a snapshot of the data taken on 23/03/2023 for the purposes of generating a mapping visualisation of recent cyclone activity. The most current database can be downloaded from the BOM website: http://www.bom.gov.au/cyclone/tropical-cyclone-knowledge-centre/databases/ Point data from the BOM has been converted into cyclone tracks for visualisation. The data and mapping layer will be refreshed annually following cyclone season (May-June each year). Last updated 21st November 2023.
-
A 2038-year South West Western Australia rainfall reconstruction. The prolonged rainfall reduction in South West Western Australia (SWWA) in recent decades has previously been reported to be unprecedented in the past 750 years. This rainfall reduction has reduced the water supply for both residents and agriculture in SWWA. However, the cause of this rainfall reduction is unclear. The relatively short length of the SWWA instrumental rainfall record limits longterm studies of SWWA rainfall. In this study, SWWA rainfall is reconstructed based on a statistically significant negative correlation between SWWA rainfall and snowfall at Dome Summit South (DSS), East Antarctica. The 2000-year DSS snow accumulation record is used to reconstruct SWWA rainfall from 22 BCE to 2015 CE. With Cumulative Summation (CUSUM) analysis applied to the rainfall reconstruction, it is found that SWWA rainfall started to reduce around 1971 CE. This prolonged rainfall reduction is unprecedented during the past 750 years, but there have been two prior droughts of similar duration and intensity during the past 2000 years. Applying statistical techniques to compare the rainfall reconstruction with climate model simulations, it is found that greenhouse gases are likely to be the dominant driver of the SWWA rainfall drying trend after 1971 CE.
-
The ETAS (Eastern TASmania) model is a high-resolution (~2 km in the horizontal) ocean model for eastern Tasmania, providing three-dimensional estimates of mean temperature, salinity, and circulation over the 1993-2016 period. This dataset consists of temperature, salinity, meridional (N-S), zonal (E-W), vertical, along- and cross-shore currents, density, sea level and net surface heat flux organised into yearly files and aggregated daily or monthly. A MATLAB script to extract portions of the data is available here: https://github.com/ecjoliver/extractETAS
-
The prolonged rainfall reduction in South West Western Australia (SWWA) in recent decades has previously been reported to be unprecedented in the past 750 years. This rainfall reduction has reduced the water supply for both residents and agriculture in SWWA. However, the cause of this rainfall reduction is unclear. The relatively short length of the SWWA instrumental rainfall record limits long term studies of SWWA rainfall. In this study, SWWA rainfall is reconstructed based on a statistically significant negative correlation between SWWA rainfall and snowfall at Dome Summit South (DSS), East Antarctica. The 2000-year DSS snow accumulation record is used to reconstruct SWWA rainfall from 22 BCE to 2015 CE. With Cumulative Summation (CUSUM) analysis applied to the rainfall reconstruction, it is found that SWWA rainfall started to reduce around 1971 CE. This prolonged rainfall reduction is unprecedented during the past 750 years, but there have been two prior droughts of similar duration and intensity during the past 2000 years. Applying statistical techniques to compare the rainfall reconstruction with climate model simulations, it is found that greenhouse gases are likely to be the dominant driver of the SWWA rainfall drying trend after 1971 CE. This record describes the Honours Thesis [available for download in 'Online Resources' section of thsi record]. For the data generated by this project, see https://metadata.imas.utas.edu.au/geonetwork/srv/eng/catalog.search#/metadata/d7d5ea56-f972-435d-b44b-44fea598150c
-
2019-20 Honours project - Environmental Drivers of Antarctic Landfast Sea Ice Formation and Breakout
Antarctic Landfast sea ice (fast ice) is important climatologically, biologically and for logistics for short time-scale anomalies. Until recently, there hasn’t been an accurate, high-resolution fast ice extent dataset which can support an analysis on drivers of fast ice and most studies only investigate fast ice on limited regions of Antarctica in a limited time scale. There is a need to extend the spatial and temporal studying coverage to provide detailed information on the Antarctic coast over a longer period. This is the first detailed analysis to identify and quantify correlation between the environmental anomaly and fast ice anomaly mainly in the east Antarctic coast. By examining regional/local fast ice extent in in east Antarctic coast in the context of the broader and/or remote-teleconnected atmospheric circulation/properties using spatial correlation techniques, a strong correlation between NINO3 region and Lützow-Holm Bay fast ice and similar and significant correlation of regional scale factors from Lützow-Holm Bay to Mawson Coast mainly are found. The results of this thesis suggest that the pack ice, atmospheric factors and oceanic factors are important for interpreting fast ice anomalies. To identify and quantify correlation between the pack ice, temperature at 2m, wind at 10m, snow fall anomaly, sea surface temperature anomaly, ocean heat content anomaly and fast ice anomaly, backward multiple linear regression is conducted to demonstrate some predictive fast ice driver information by quantifying the correlation between different drivers and fast ice anomaly. The multiple linear regression also suggests that oceanic influences including pack ice are generally more important than atmospheric influences. Future experiments could be conducted to interpret fast ice anomalies in the context of the ocean mainly.
-
The ETAS (Eastern TASmania) model is a high-resolution (~2 km in the horizontal) ocean model for eastern Tasmania, providing three-dimensional estimates of daily temperature, salinity, and circulation over the 1993-2014 period. This dataset consists of eastward (u) and northward (v) currents organised into yearly files.
-
This record contains: 1. Thesis 2. The MATLAB codes of the adaptive Canny gradient-based edge detection algorithm and calculating frontal probability/density (for AVHRR data and MODIS data separately). 3. Frontal probability (probability of frontal encounter, PFE) and frontal density (FD) data over Australian hotspot regions (for AVHRR data and MODIS data separately) 4. Results of the Mann-Kendall trend test The purpose of this study is to verify the regional trends of frontal activity within the two marine hotspots near Australia and compare the performance of the two edge detection algorithms.
-
The ETAS (Eastern TASmania) model is a high-resolution (~2 km in the horizontal) ocean model for eastern Tasmania, providing three-dimensional estimates of daily temperature, salinity, and circulation over the 1993-2014 period. This dataset consists of hourly temperature, salinity, sea level, eastward (u) and northward (v) currents (at depth and vertically-averaged) at selected locations.